

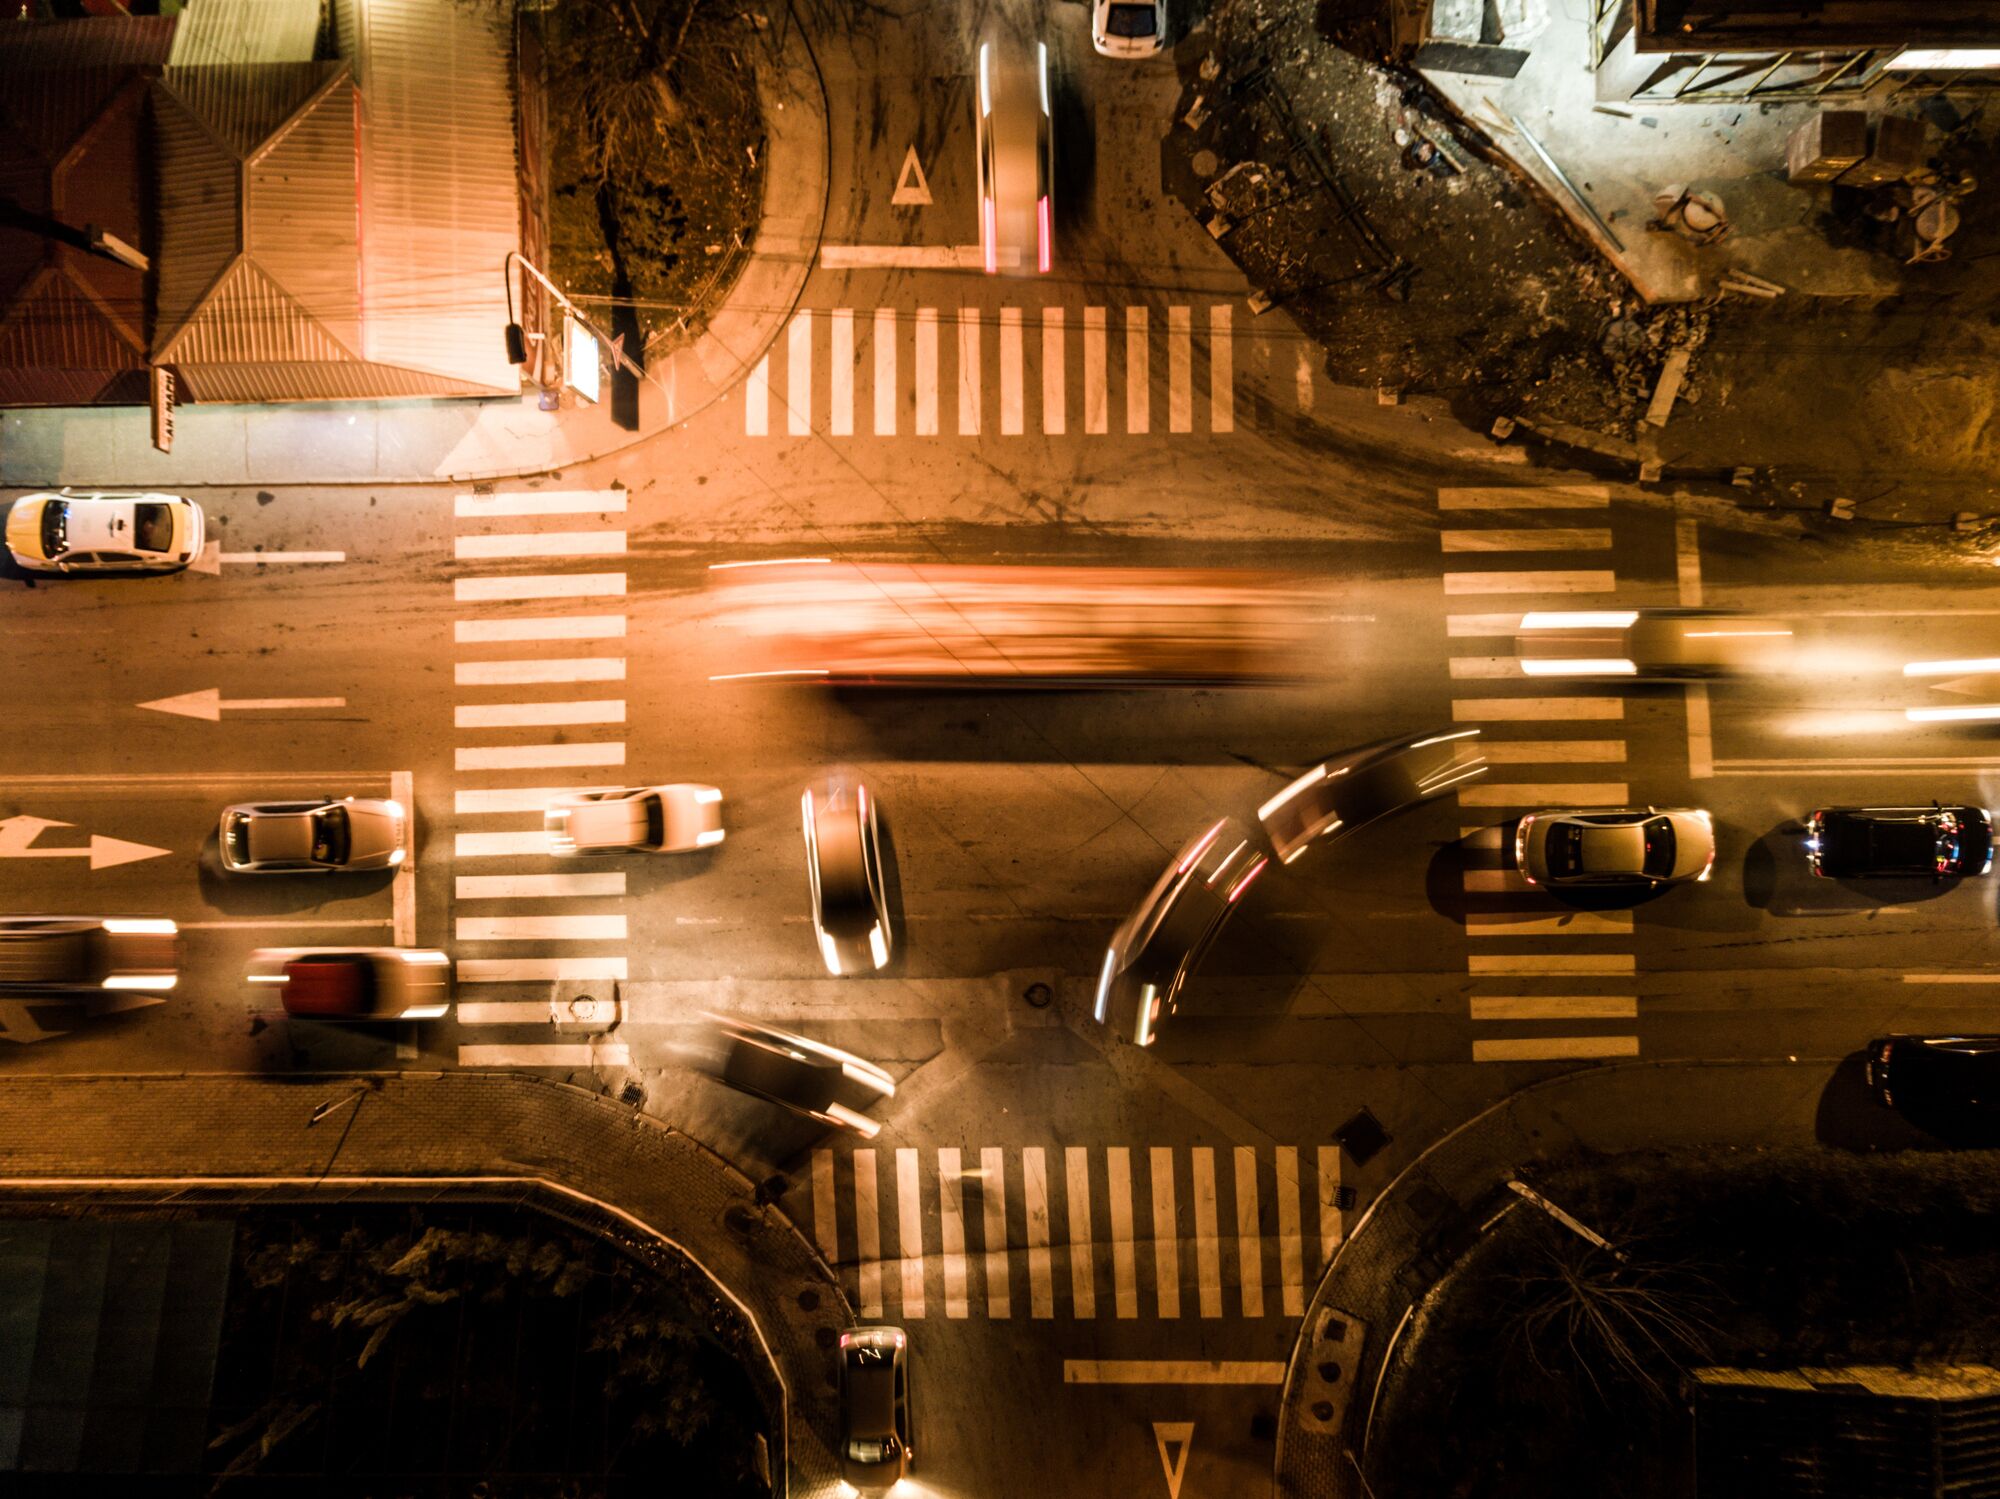
San Jose, located in the heart of Silicon Valley, is a dynamic metropolitan city characterized by rapid growth, a booming tech industry, and a rich diversity of people. As the city continues to expand, so too does its infrastructure, leading to more traffic and greater demands on its roadways. With an increasing number of vehicles, cyclists, and pedestrians sharing the streets, the intersections in San Jose have become critical areas where collisions frequently occur, creating significant challenges to maintaining road safety.
To identify the city’s most hazardous areas, our San Jose accident attorneys analyzed crash data from the Statewide Integrated Traffic Records System (SWITRS), which was cleaned and geocoded by the Transportation Injury Mapping System (TIMS) from 2020 to 2024. Our study focuses on the 10 most dangerous intersections in San Jose, comparing the city’s proportion of intersection crashes with other major California cities, along with a breakdown of crash severities.
By highlighting these high-risk intersections, we aim to bring attention to critical traffic safety concerns and areas that may benefit from improved infrastructure or enforcement.
Key Findings:
- East Capitol Expressway and Senter Road is the most dangerous intersection in San Jose.
- San Jose’s intersection crash rate is 22.93% higher than the average of California cities.
- The city’s fatal injury rate for intersection crashes is 23.10% lower than the cross-city average of 2.34%, and the serious injury rate is 30.70% lower than the cross-city average of 9.20%.
San Jose’s Most Dangerous Intersections
San Jose’s Most Dangerous Intersections, Ranked by Danger Score
The intersections below are ranked based on their “danger score,” which takes into account the total number of crashes over five years, along with the severity of each crash. Crashes with more serious outcomes are weighted more heavily, highlighting intersections with the highest potential for harm.
East Capitol Expressway and Senter Road tops the list, with 34 crashes and a danger score of 74. Its central location and the convergence of major streets likely contribute to high traffic flow and a significant number of collisions.
The second most dangerous intersection in San Jose is Capitol Expressway and Tully Road, which saw 38 crashes and earned a danger score of 68. McKee Road and North Capitol Avenue ranks third with 30 crashes and a danger score of 67. As another major connector within the city, this intersection sees a mix of commuter and local traffic, which raises the likelihood of accidents.
San Jose’s Intersection Crash Rate Vs. Other California Cities
Next, we analyze dhow San Jose’s intersection crash rate compares to those of other cities in California.
The average proportion of intersection crashes across all studied California cities is 37.16%, with San Jose’s rate of 45.69% being approximately 22.93% higher than the average.
Injury Severity Distribution in San Jose Intersection Crashes
Lastly, we offer a detailed breakdown of intersection crashes, categorized by severity: fatal, serious, minor, and possible injuries.
San Jose experiences a fatal injury rate of 1.80% in intersection crashes, which is 23.1% lower than the cross-city average of 2.34%. Similarly, San Jose has a serious injury rate of 6.38%, which is approximately 30.7% less than the cross-city average of 9.20%.
The data further reveals that San Jose has 33.18% minor injuries and 58.64% possible injuries occurring in intersection crashes. These figures indicate that over 91% of intersection crash injuries in San Jose are categorized as less severe.
Conclusion
While San Jose has a significantly higher intersection crash rate than the average for California cities, its fatal and serious injury rates are notably lower. This suggests that while crashes are more frequent, they tend to result in less severe outcomes compared to other areas. However, certain intersections, such as East Capitol Expressway and Senter Road, experience a high volume of crashes. Addressing these high-risk locations through infrastructure upgrades, enhanced traffic management, and enforcement measures can help mitigate risks and improve intersection safety across the city. If you were injured, you can contact our San Jose personal injury lawyers today.
Methodology
For this study, we analyzed crash data from the Statewide Integrated Traffic Records System (SWITRS), which was cleaned and geocoded by the Transportation Injury Mapping System (TIMS) from 2020 to 2024. The dataset specifically includes crashes with reported or suspected injuries, omitting minor crashes without injury reports.
Fair Use Statement
If you think this article would be beneficial to others, we encourage you to share it, with proper attribution by including a link to this page.